API request logs (S3)
Search requests to PIM and ComHub by date, source, and identifier; review details of the request and response.
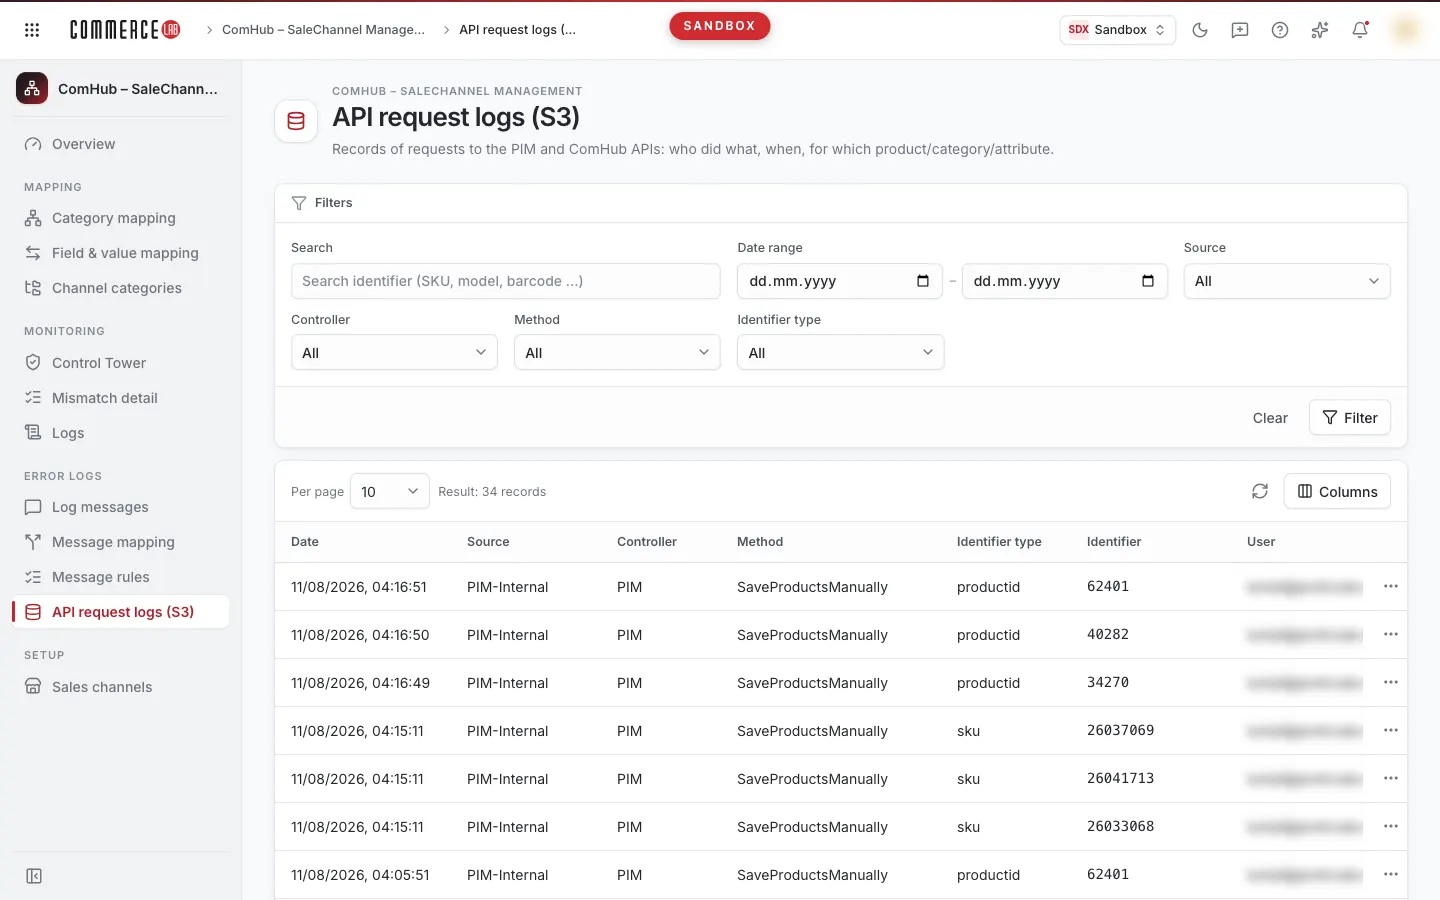
The API request logs (S3) screen displays a record of requests made to PIM and ComHub: who performed what action, when, and for which product, category, or attribute. It is used to investigate why a product changed, which request an integration sent, or what response the system gave to a request. This screen is mostly used by support and catalog teams examining integration issues. The screen is view-only; no changes can be made to the records.
Accessing the screen
Navigate through the menu: ComHub – Marketplace Integration › Error logs › API request logs (S3).
If you do not see it in the menu, your account does not have permission for this screen.
Screen sections
- Warning strip (only if the selected date range is invalid): At the top, explains why the range was not accepted.
- Title: API request logs (S3) with a brief description below.
- Filter area: Search box, Date range, Source, Controller, Method, and Identifier type fields; below are Clear and Filter buttons.
- List: At the top, Per page selection, "Filter result: … records" count, refresh icon, and Columns menu; below are the request records and pagination.
- Note: Below the list, a summary of date and search rules.
- Detail drawer: When you open a record, a panel opens from the right showing details of the request and response.
Filtering and searching
| Field | Purpose | Tip |
|---|---|---|
| Search | Searches within the identifier (e.g., SKU, model, barcode, category number). | The fastest way to find requests related to a specific product or category. |
| Date range | Sets the start and end days for requests. | If no date is selected, the last 7 days are searched. You can select a maximum 7-day range; start and end days are inclusive. |
| Source | Filters by the source of the request. Default is All. | Select the source first and apply; the options in the lower fields will narrow accordingly. |
| Controller | Filters by the section the request belongs to. Default is All. | Options depend on the applied Source selection. |
| Method | Filters by the performed action. Default is All. | Options depend on the applied Source and Controller selections. |
| Identifier type | Filters by the type of identifier. Default is All. | Options depend on the three selections above. |
Values you enter or select are not applied immediately. Press the Filter button or Enter while in a field. Clear removes all filters, date range, and search.
The Controller, Method, and Identifier type options are listed based on the applied (i.e., after pressing Filter) upper selection; unconfirmed selections do not narrow the lists. To narrow step-by-step:
- Select Source and press Filter.
- The Controller list now shows only sections for that source; select one and press Filter again.
- Continue similarly with Method and Identifier type.
When changing the source, check the lower selections as well. A Controller or Method from the previous source may remain selected, resulting in an empty list. Set these fields to All if needed.
Date range rules
- If no date is selected, the last 7 days including today are searched.
- If only the end date is selected, the 7 days backward including the end day are searched.
- If only the start date is selected, the end date is considered today. If the start is older than 7 days, no list is returned and "Something went wrong" error appears in the list area.
- If both dates are selected and the range exceeds 7 days, a warning "A maximum 7-day range can be selected (selected: … days)." appears at the top and no list is returned.
- If the end date is before the start date, a warning "End date cannot be before start date." appears and no list is returned.
- When a warning appears, "Something went wrong" also shows in the list area; correct the range and press Filter again.
List
| Column | Meaning |
|---|---|
| Date | The date and time the request was recorded. This column cannot be hidden. |
| Source | The source of the request. |
| Controller | The section the request belongs to. |
| Method | The performed action. |
| Identifier type | The type of identifier related to the request. |
| Identifier | The identifier of the related record (e.g., SKU or category number). |
| User | The user who made the request. |
| IP address | The IP address from which the request originated. |
| Log no | The record number; also shown in the detail drawer header. |
- Cells without values show "—".
- Default page size is 10; you can select 5, 25, 50, or 100 from Per page.
- You can hide columns except Date from the Columns menu; your selection is saved in your browser.
- The list cannot be sorted; clicking column headers does not change sorting.
- Clicking a row or selecting Open detail from the three-dot (Row actions) menu opens the record's detail drawer.
Detail drawer
The drawer's title is in the format Request log #…. The list remains in the background; closing the drawer returns you to the same page and position. While open, the page URL includes the record; sharing this link opens the same record (if the user has permission).
From top to bottom, the drawer contains:
| Section / field | Meaning |
|---|---|
| Hide warning | If any fields are hidden for security, it states "For security, … field is hidden (authorization header, cookie, password, token …)." |
| Request time | The date and time the request was made. |
| User | The user who made the request. |
| Server | The name of the server that handled the request. |
| Request | The type and address of the request. |
| Query string | Parameters sent with the address. |
| Response code | The response code the system returned. Red: 400 and above (error); yellow: 300s; green: successful response. |
| Request body | Data sent with the request. |
| Response body | Data returned by the system. |
| Request headers | Header information of the request, with Title and Value columns. |
- Fields without values and empty bodies show "—".
- You can copy the entire text of request and response bodies using the Copy icon at the top right; after copying, the tooltip briefly changes to Copied. If copying fails, a "Failed to copy to clipboard" notification appears.
- If the body is very long, a note "Body too long; showing first 20,000 characters." appears below.
- Sensitive values like passwords, tokens, cookies, and authorization headers are shown as hidden; you cannot view them from this screen.
Common situations
- The list is empty. If "No records in this range" appears, no requests match the filters in the selected range. Change the date range or clear filters. If you changed the source, a Controller or Method from the previous source may remain selected.
- Warning or "Something went wrong" appears instead of the list. The date range may be longer than 7 days, reversed, or the start date older than 7 days. Correct the range and press Filter. To examine longer periods, search in 7-day segments. If the range is correct, press Retry.
- The Controller list does not show the value I want. Options depend on the applied Source. Ensure you pressed Filter after selecting the source or set Source to All.
- "Something went wrong" appears in the detail drawer. The record could not be read; it may have been deleted or the log storage is temporarily inaccessible. Press Retry; if the problem persists, contact your system administrator.
- "Log service not configured in this environment" appears in detail. This is not an error but indicates a missing setup in the environment. Contact your system administrator.